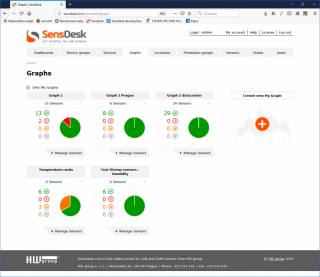
In addition to basic functions, such as providing a concise overview of the states and current readings of detectors and sensors, the SensDesk portal can plot the history of the measured values in graphs. Graphs in SensDesk can be also used for additional analyses.
The My Graph function allows to create graphs with sensors of different quantities connected to different devices. For example, it is possible to plot a chart of all temperature sensors connected to your Poseidon2 4002, and leave out any other sensors or devices.
This function is beneficial in the long-term in cost optimization. For example, let us consider several server rooms. In one of the rooms, A/C fails or the door remains open. In a graph, it is possible to see the effects of this incident on the temperature, and thus on the operational costs of maintaining proper conditions.

