HWg-STE
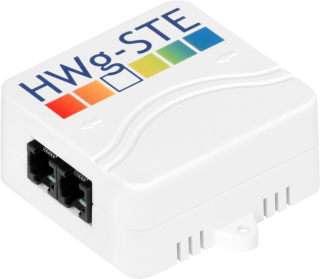
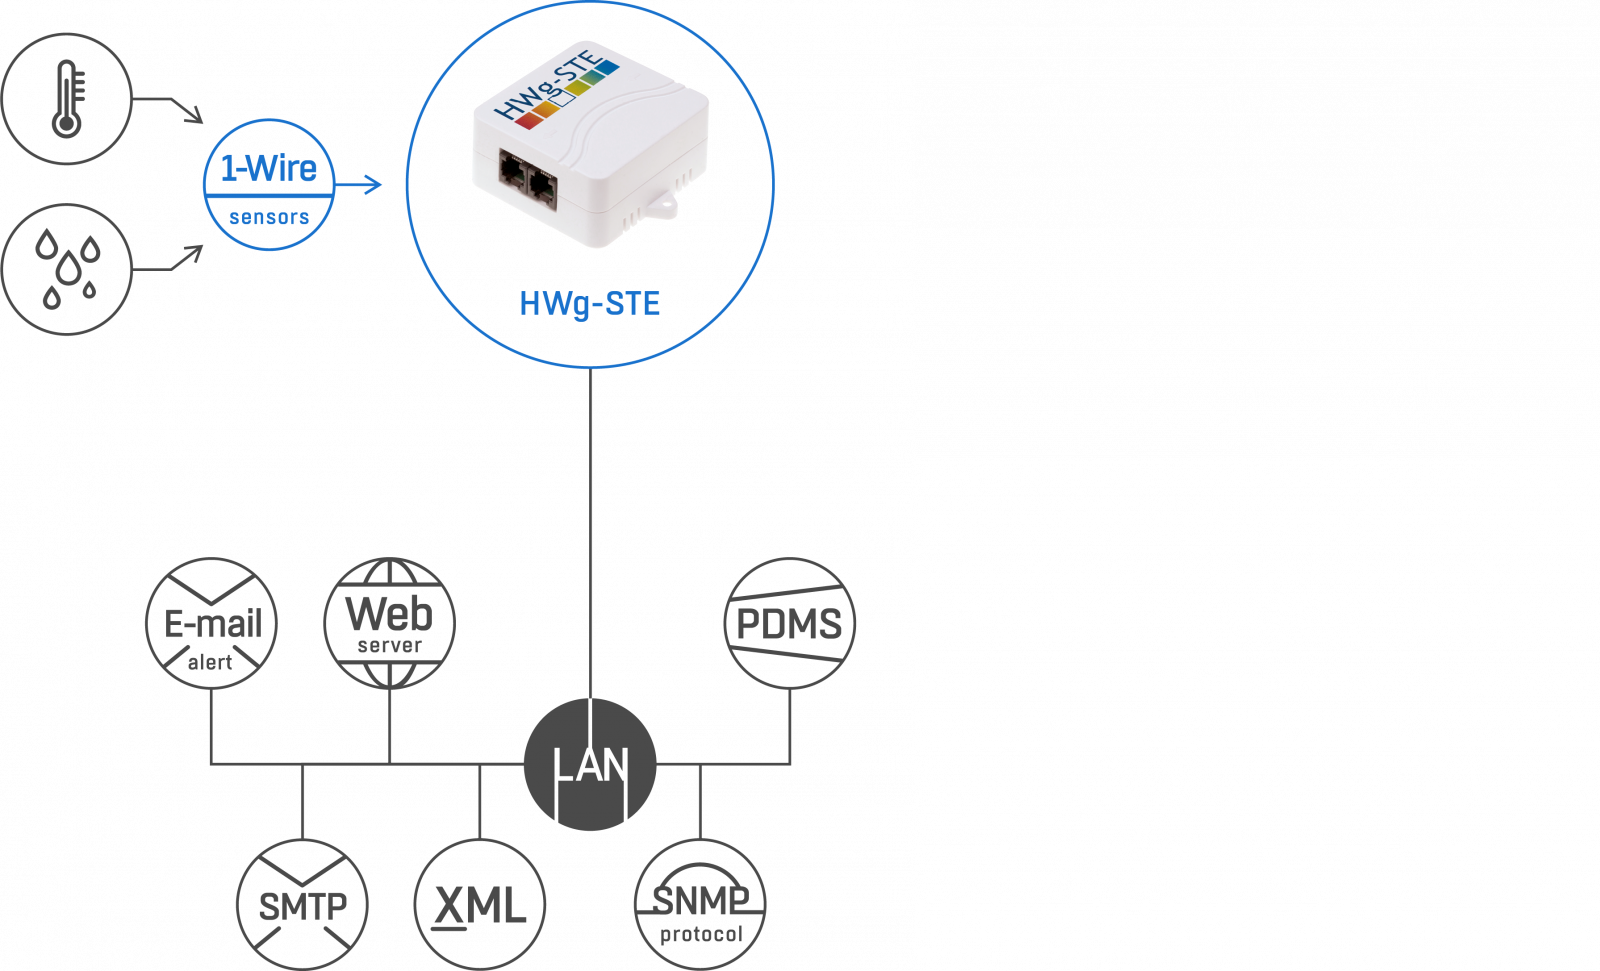
HWg-STE can connect up to two sensors of temperature or humidity via RJ11 (1-Wire).
A built-in web server is used for configuring. The device can be monitored remotely over the internet via SNMP. It is supplied with external temperature probe (3m cable), power adaptor and free HWg-PDMS software to create graphs and export data to MS Excel.
HWg-STE is a device for measuring temperature and humidity from external sensors, with the option of connection to the internet via Ethernet. In case the permitted range of values is exceeded, HWg-STE sends an alarm via e-mail (SMTP TLS is not supported).
- 2x RJ11 (1-Wire) port for Sensors
- 2x E-mail alert (no SMTP TLS)
- M2M communication protocols: SNMP, XML
- Connected via LAN. Configuration via built-in web server.
- NMS connectivity (SNMP MIB); simple installation; supports DHCP.
- A sensor value out of a set safe range sends an alert by E-mail.
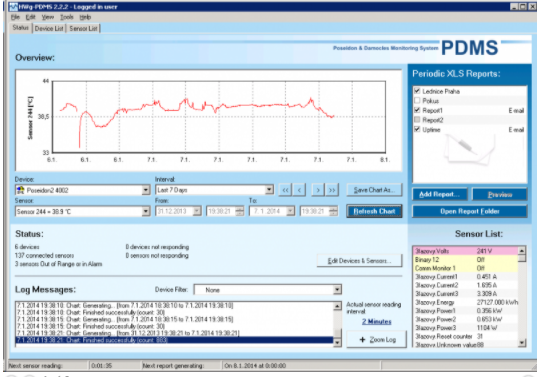
- With the HWg-PDMS software, logged data can be exported to MS Excel.
- Compatible with a range of third party SW. Examples for programmers on using the product are available in the HWg-SDK (Borland C++, MS Visual, VB, C#, PHP, JAVA and more).
- Air conditioning failure
- Heating system monitoring
- Cooler/freezer monitoring
- Heating optimization
- Food storage
- Remote rack monitoring
HWg-STE is an Ethernet thermometer (hygrometer) with SNMP and WEB interfaces. Web thermometer with a LAN connection, built-in web interface and SNMP support and free software for creating MS Excel reports. Sends an e-mail alert if the temperature goes out of a specified range. Typical applications include monitoring the temperature of equipment, computers or disk arrays, or monitoring HVAC operation.
Warning: HWg-STE do not support SMTP TLS. To sending email alerts via Gmail SMTP server for example use the STE2 device.
The chart in the interface is based on Adobe Flash whose support ends at the end of 2020.
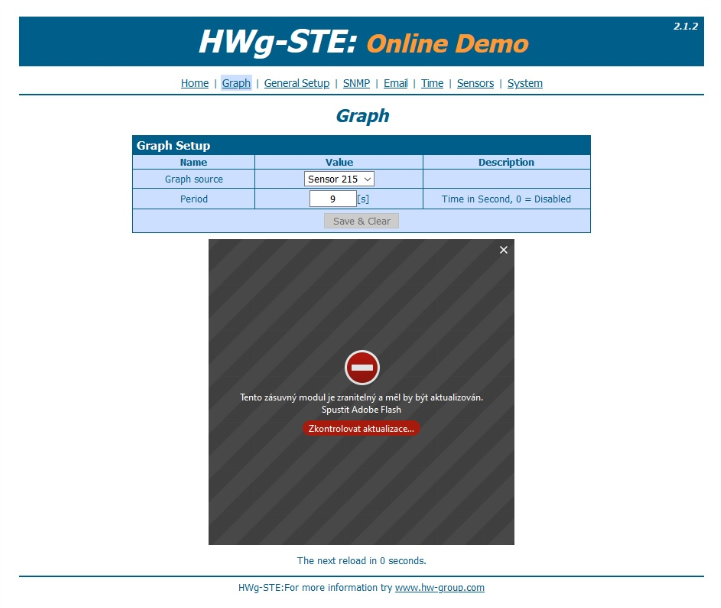
There is no loss of functionality as you can view your graphs via PDMS software.
