Monitoring
Environment, building equipment, industrial sites and ITsystems, as well as utilities, need to monitor their environment and operational conditions reliably and efficiently. An overview of selected variables such as temperature, pressure, dew point, lighting level, air quality, machine operation or vibration, provide a comprehensive picture of the state of the equipment and enable the operator to respond appropriately.

Do you know how to work with Ares through SMS commands?
Poseidon – hysteresis - Preventing false alarms
MQTT - Universal Protocol for Cloud and IoT
How to send SMS via HWg-SMS-GW3?
Icons and colors in SensDesk
In SensDesk, each sensor and device state has its specific color and icon. This scheme is consistent throughout the portal.
Horizontal menu
Dashboard and My Dashboard functions in the SensDesk portal
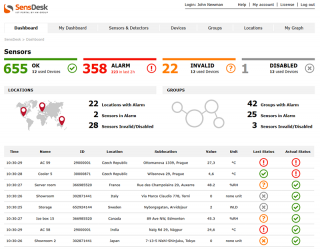
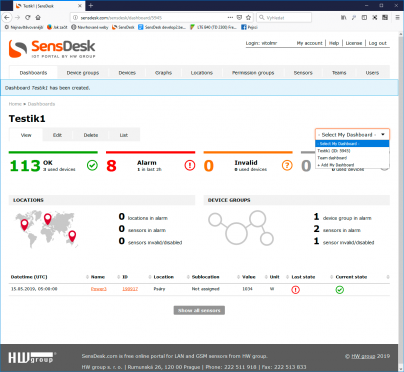
The Dashboard gives a quick status overview of equipment or environment. It is a common feature of all monitoring systems, including SensDesk.
The Dashboard is displayed immediately after the user logs in, or by clicking the corresponding link in the menu. Besides the main Team Dashboard, SensDesk also supports user-defined dashboards, e.g. for use by different departments or branches – My Dashboard.
Horizontal menu
The Dashboard displays information from devices added to the Team. However, it does not necessarily include information about all devices, locations or groups. As explained below, the information to be displayed can be changed by editing the Dashboard.
In SensDesk, the Dashboard focuses on the sensor states, not the sensor values or the device status (that is only supplementary information). It consists of three parts. The first part gives a quick sensor state overview, grouped by sensor state and showing the number of sensors in that state. Each state has a specific color and icon; this scheme is applied throughout the SensDesk portal.
| Status | Color | Sensor icon | Device icon |
| OK | Green |  |
 |
| Alarm | Red |  |
 |
| Unknown | Orange |  |
 |
| Invalid | Orange |  |
 |
| Disabled | Gray |  |
 |
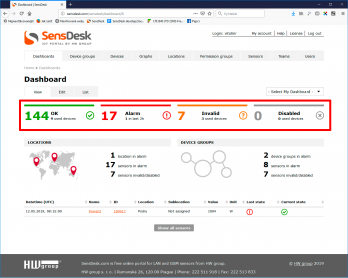 The green color indicates sensors that are in the OK state, that is, they communicate normally and their value is within the allowed “safe range”. A device is OK as long as all of its sensors and detectors are OK. The Dashboard shows how many sensors are OK and on how many devices. The latter piece of information is particularly useful for devices that are turned off (Disabled) or malfunctioning (Invalid) as it allows to distinguish a problem with a sensor from a problem with an entire device. Click the OK block to go to the list of sensors in that state.
Red means Alarm, i.e. the reading of a sensor or a detector is outside of the specified safe range. If a sensor or detector is in the Alarm state, the entire device is in the Alarm state, too. Sensors that do not communicate (are disconnected) are not listed in the Alarm section but rather in the Invalid section, even though alarm notifications are still sent for these sensors. This makes it easier to identify problems. The Dashboard also gives an overview of the number of alarms for the past 2 hours (bottom part of the page), so that there is a quick way to see the recent history of alarms, including those that only lasted a short time. This makes it easier to identify the problem if the user received a notification but the alarm ended before the user had a chance to look at it in SensDesk. Click the Alarm block to see a list of sensors in that state.
The orange color represents sensors in the Invalid state, i.e. sensors that either do not communicate at all (disconnected or destroyed), or are not sending valid data (faulty or damaged). Unlike the Alarm state, the Invalid state does not propagate to the device; a distinction is maintained between the Sensor invalid and the Device invalid states. In particular, Sensor invalid means one or more faulty sensors, while Device invalid means a faulty device. On the other hand, when a device is in the Device invalid state (e.g. due to loss of communication), all its sensors and detectors are also reported as Device invalid, so that it is possible to distinguish sensor faults from device faults. In the Dashboard, the Invalid section lists the number of sensors in the Invalid state, regardless of the cause. The number of devices with such sensors is also shown. Click the Invalid block to see a list of sensors in that state.
The grey section represents Disabled sensors. At the first glance, the number of sensors disabled by the user may not look like an interesting piece of information; however, it is very useful when diagnosing a problem. Sensors and detectors (digital inputs) can be disabled by the user at the Edit Sensor page of the respective sensor, digital input or output. Sensors may be disabled to make the SensDesk overview more concise or to avoid storing unnecessary data. It is also possible to disable (and remove from reports) unused digital inputs, outputs, or for instance counter values. The disabled items are then listed under Disabled so that they are easy to find if needed. In the Dashboard, the Disabled section shows the number of sensors as well as the number of devices with these sensors. Click the Disabled block to see a list of sensors in that state.
The sensor block only displays information about sensors and digital inputs of devices that the user has selected at the Edit Dashboard page.
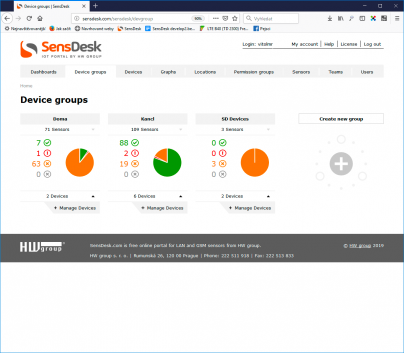
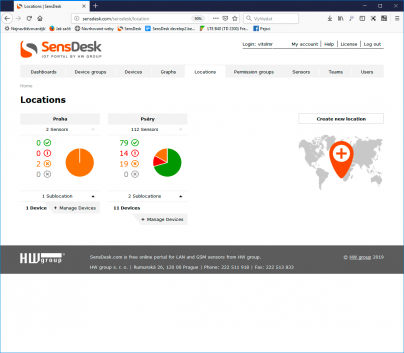
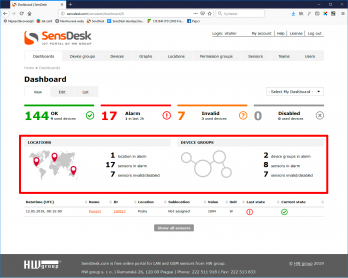 The next important section is the list of Locations and Device groups. This section gives an overview of how many Locations and Device groups are in Alarm, that is, contain at least one sensor in Alarm, how many sensors are affected and how many sensors are Invalid or Disabled. It is a different presentation of the same information as above.
The Locations and Device groups block only displays information about sensors and digital inputs of devices that are assigned to Locations and Device groups selected by the user at the Edit Dashboard page.
The last part of the Dashboard is a list of last sensor state changes (that is, transitions from no alarm to alarm and vice versa, loss of communication, and so on). The table only lists the last state change for each sensor, and by default only in the last 2 hours.
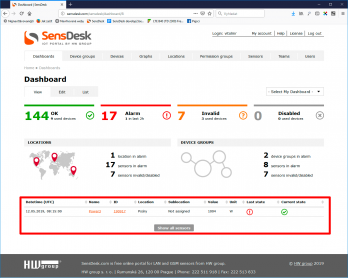 The list always includes the date and time of the state change in UTC (universal time, without regard to the user’s time zone); the name and ID of the sensor, digital input or digital output in question; the Location and Sublocation assigned to the sensor; the current value and its unit of measurement; and the previous and current state. Clicking the sensor name or ID leads to more details about the sensor.
The Current state column displays the current sensor state, while the Last state column displays the previous state. In this way, it is easy to see e.g. that a sensor or a digital input has transitioned from the Alarm state to the OK state or vice versa. It is also possible that both columns show the Alarm state; this can happen, for example, when the sensor was in Alarm because its reading was below the Safe range, and then the reading jumped to a value above the Safe Range.
To display the last sensor state changes regardless of when they have happened, click the Show all sensors link.
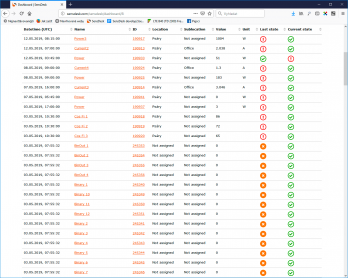 There is one particularity with the list of sensor state changes. Since the table displays state changes, for new devices the state may not be shown or may show as Invalid because there is no record of a state change yet.
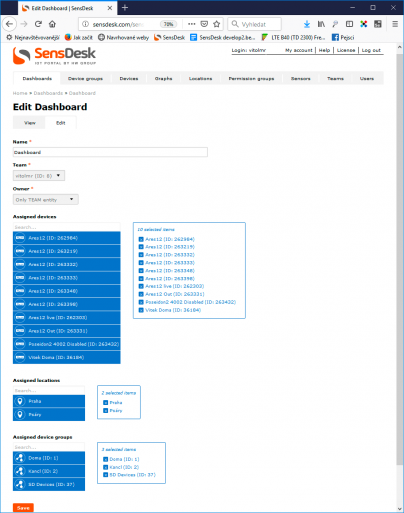
To edit the Dashboard, click the Edit tab under the Dashboard name. The process is the same as if creating a custom dashboard – see below.
What is My Dashboard
My Dashboard is the possibility to create additional dashboards with different contents. While the main Dashboard is the same for the entire Team, individual departments or users can define their own dashboards (i.e. devices to monitor) in order to simplify their view of the monitored environment. This function is particularly useful in large installations where users can define separate views with devices that monitor different sets of equipment in order to see only sensors and devices that they are interested in.
Working with My Dashboard
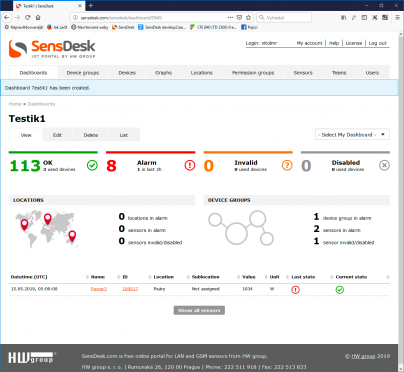
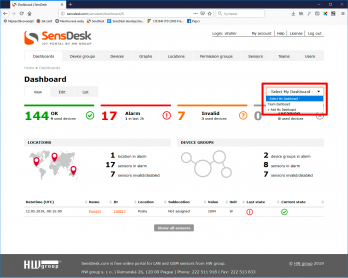 Working with Dashboards in SensDesk is similar to working with Device groups, Locations or My Graph. To work with the Dashboards, use the Dashboards item in the menu. To create Dashboards and switch among them, use the Select My Dashboard drop-down menu in the top right-hand corner of the Dashboard.
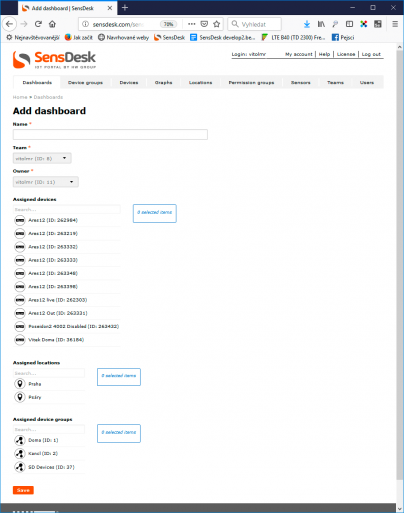
To create a new dashboard, click +Add my Dashboard to open the new dashboard creation menu. Set a name for the new Dashboard and assign devices, locations and groups to it. To select devices, click their names. Selected devices are highlighted in blue and also shown in the pane at the right-hand side. In the same way, selected Locations and Device groups are highlighted.
The sensor block only displays information about sensors and digital inputs of devices that are listed among Assigned devices. Sensors, digital inputs and outputs of devices in the Assigned locations and Assigned device groups are not automatically included in the sensor block.
After saving, the Dashboard page is displayed and the data loaded. To switch among Dashboards, use the drop-down menu.
Users of the SensDesk Technology portal can create My Dashboard. If more are needed, users are advised to contact their distributor and agree on the conditions of using extended SensDesk functions, such as increased number of supported devices, extended the datalog length or increased number of custom dashboards or graphs.
Download
SensDesk portal as a unified monitoring center
Create custom views and graphs, arrange devices into groups and view your sensor data in custom graphs. These are the basic SensDesk features. The new portal adds many functions for the administration of large-scale monitoring applications and sensor networks. At the same time, it unifies the communication with and control of all HW group devices, including the communication among them. SensDesk can be also connected to monitoring applications.
Horizontal menu
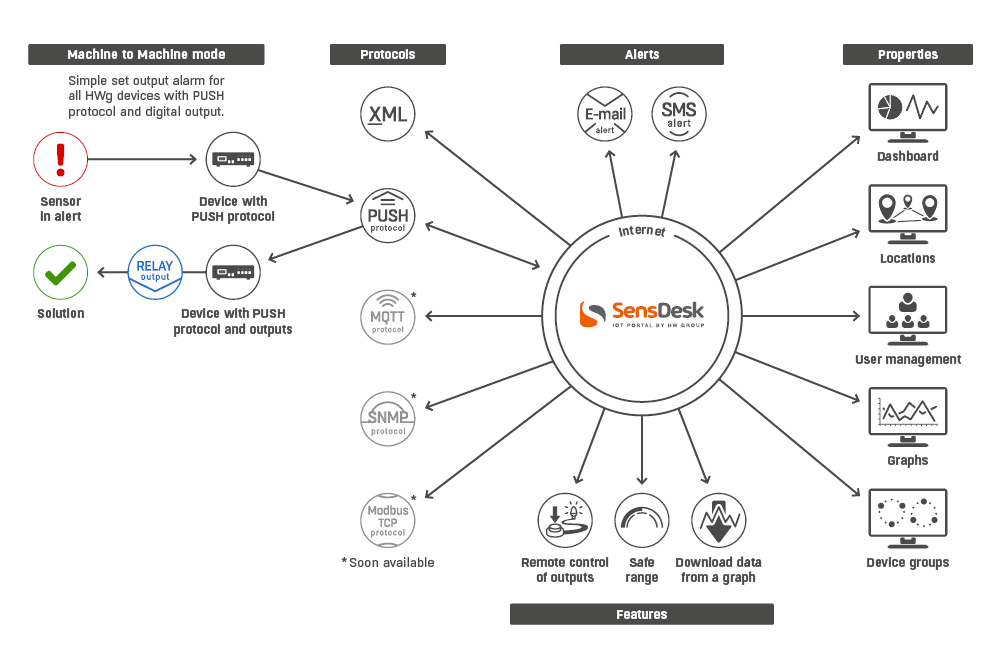
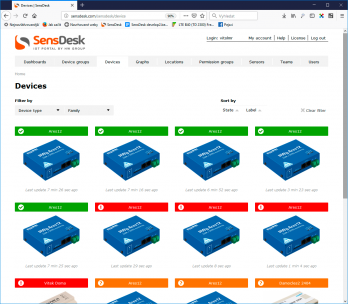 When speaking of a Portal or a Cloud, most people think of a website with graphs or a remote repository that costs money. And it is often the case. However, SensDesk by HW group is not just a portal or a cloud; it is primarily a unified measuring and control center for HW group products. SensDesk gives a quick overview of sensor states, displays a history of measured values, and allows creating simple conditions to trigger alarm actions such as sending an e-mail or a text message or activating a remote output. Its main advantage is the unified presentation of information from many different sensors and detectors in a human-readable and a machine-readable form.
The SensDesk portal offers features for home users, small and medium-sized businesses (SMB), as well as large enterprises and corporations. For homes and small offices, it is often enough to monitor the current states of sensors and detectors, and to be able to download the past temperature or consumption values (or to receive an e-mail if a value is out of an allowed range). Larger clients put emphasis on the integration of independent monitoring with existing systems. This can be complex, and thus expensive, because different measuring devices provide data in different formats – either for legacy reasons, or due to the particularities of the measured quantities. In these cases, SensDesk provides the most value – it makes data from different sensors and devices available in a unified and serialized XML file format.
Basic SensDesk features
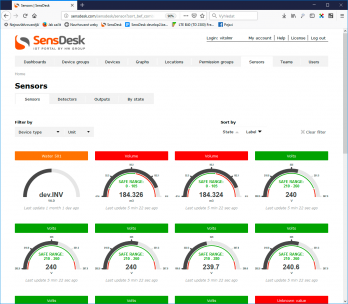 A simple and concise Dashboard provides an overview of only those sensors that are interesting for the user. Multiple custom Dashboards with different contents can be defined. For example, the IT department would only watch the data that is relevant for them, and so would the power engineers.
- Independent Safe Ranges can be set for each sensor for the purposes of e-mail alerts. Support for HWg-SMS-GW3 in order to send alerts via text messages (SMS).
- An overview of devices and sensors that can be sorted by the status (Normal, alarm, invalid) or by the unit of measurement.
- Devices and sensors can be grouped according to their physical (Locations) or logical (Groups) place.
- Graphs of measured values for individual values (sorted by the measured quantities) as well as for individual sensors; data can be exported to CSV, XML, PDF, SVG, PNG or JPG
- Custom graphs combining different quantities can be created to watch for interdependencies.
- Advanced user management with a simple administration can assign individual users only the permissions they need. Individual users are grouped under a Team.
- Permission groups to assign users the rights to individual devices. While the User management restricts what the user can do, the Permission group restricts the resources that the user works with.
- Export of current values to XML is available for all values belonging to a team as well as for individual dashboards and graphs, and provides for an easy integration with ERP systems.
- SensDesk Technology can be used as either free HWg-cloud.com or paid SensDesk.com platform operated by HW group, platform by another portal provider, or on the customer’s premises using a virtual server.
There is no need to list the common features of all portals, such as the ability to display the readings from individual sensors and detectors and plot their history in a graph.
SensDesk unifies measurement and control
SensDesk integrates the monitoring and control of all types of HWg devices, including the communication among them. All settings are done in the SensDesk portal.
In SMB and home applications, monitoring is easy to install given the small number of devices and locations and the simplicity of user permissions. However, infrastructure maintenance projects and large-scale deployments need to access the data in SensDesk through various extensions and third-party monitoring applications.
Advanced functions of the portal include the integration and mutual control among all types of HWg devices.
Monitoring center – Alarm messages and the control of other devices
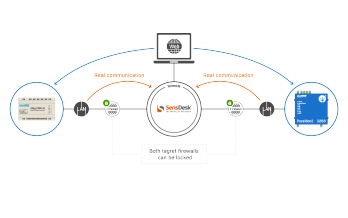
The SensDesk portal can be used to quickly set up the communication among all types of HW group devices. It is the most effective way to establish feedback between HWg sensors and actuators.
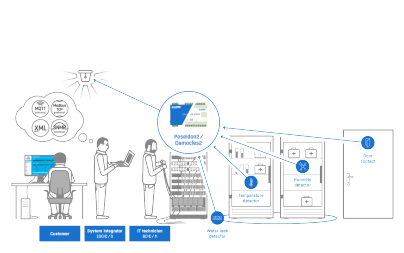
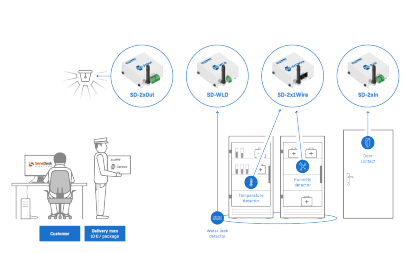
As already mentioned, SensDesk allows to set a Safe Range for each sensor or detector and trigger an alarm action whenever this range is exceeded. The action can be the sending of an e-mail or a text message (HWg-SMS-GW3 required). Another possible action is the activation of an output at one of the monitored devices. For example, if there is a water leak from an air conditioning or heating system at your Prague site, another device in the monitoring center in London can close its contact to sound a warning horn. While the boxes themselves are capable of doing that, by using SensDesk as the monitoring and control center, equipment and installation costs can be significantly reduced. With SensDesk, HW group devices of different product lines can be integrated; for instance, a HWg-WLD water leak detector can control an output of a SD-2xOut device, without a Poseidon2 or Damocles2 unit that would be required for a direct connection. The purchase price of a SD-2xOUT device comes to about 30% of the cheapest Damocles2 product – the Damocles2 MINI.
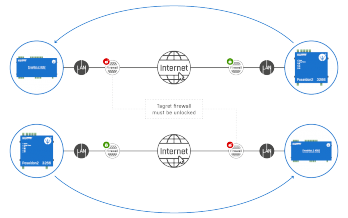
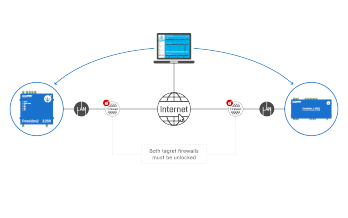
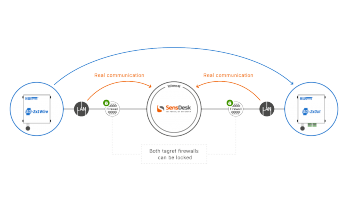
The SensDesk portal also simplifies the installation. It enables bidirectional communication without the need to configure network equipment or to tunnel ports. In order to control a device from another one, if the devices are not connected directly to the Internet with public IP addresses, routers need to be specially configured. The SensDesk portal makes things simple - all devices communicate with SensDesk only, and the portal is in the public Internet.
Interoperability of HW group devices when using direct connections
| Local Condition | Controlled | Poseidon2 3268 | Poseidon2 4002 | Poseidon2 3468 | Damocles2 MINI | Damocles2 1208 | Damocles2 2404 | Ares12 | SD-2xOUT | IP WatchDog2 Lite | IP WatchDog2 Industrial |
|---|---|---|---|---|---|---|---|---|---|---|---|
| Controlling | |||||||||||
| Poseidon2 3266 |  |
 |
 |
 |
 |
 |
 |
 |
 |
 |
|
| Poseidon2 3268 |  |
 |
 |
 |
 |
 |
 |
 |
 |
 |
|
| Poseidon2 4002 |  |
 |
 |
 |
 |
 |
 |
 |
 |
 |
|
| Poseidon2 3468 |  |
 |
 |
 |
 |
 |
 |
 |
 |
 |
|
| Damocles2 MINI |  |
 |
 |
 |
 |
 |
 |
 |
 |
 |
|
| Damocles2 1208 |  |
 |
 |
 |
 |
 |
 |
 |
 |
 |
|
| Damocles2 2404 |  |
 |
 |
 |
 |
 |
 |
 |
 |
 |
|
| Ares12 (LTE) |  |
 |
 |
 |
 |
 |
 |
 |
 |
 |
|
| HWg-PWRxx |  |
 |
 |
 |
 |
 |
 |
 |
 |
 |
|
| SD-2x1Wire |  |
 |
 |
 |
 |
 |
 |
 |
 |
 |
|
| SD-2xIn |  |
 |
 |
 |
 |
 |
 |
 |
 |
 |
|
| SD-WLD |  |
 |
 |
 |
 |
 |
 |
 |
 |
 |
|
| HWg-STE Plus |  |
 |
 |
 |
 |
 |
 |
 |
 |
 |
|
| STE2 |  |
 |
 |
 |
 |
 |
 |
 |
 |
 |
|
| HWg-WLD |  |
 |
 |
 |
 |
 |
 |
 |
 |
 |
|
| WLD2 |  |
 |
 |
 |
 |
 |
 |
 |
 |
 |
|
| IP WatchDog Lite |  |
 |
 |
 |
 |
 |
 |
 |
 |
 |
|
| IP WatchDog Industrial |  |
 |
 |
 |
 |
 |
 |
 |
 |
 |
|
Using SensDesk as a communication center
| Push protocol | Controlled | Poseidon2 3268 | Poseidon2 4002 | Poseidon2 3468 | Damocles2 MINI | Damocles2 1208 | Damocles2 2404 | Ares12 | SD-2xOUT | IP WatchDog2 Lite | IP WatchDog2 Industrial |
|---|---|---|---|---|---|---|---|---|---|---|---|
| Controlling | |||||||||||
| Poseidon2 3266 |  |
 |
 |
 |
 |
 |
 |
 |
 |
 |
|
| Poseidon2 3268 |  |
 |
 |
 |
 |
 |
 |
 |
 |
 |
|
| Poseidon2 4002 |  |
 |
 |
 |
 |
 |
 |
 |
 |
 |
|
| Poseidon2 3468 |  |
 |
 |
 |
 |
 |
 |
 |
 |
 |
|
| Damocles2 MINI |  |
 |
 |
 |
 |
 |
 |
 |
 |
 |
|
| Damocles2 1208 |  |
 |
 |
 |
 |
 |
 |
 |
 |
 |
|
| Damocles2 2404 |  |
 |
 |
 |
 |
 |
 |
 |
 |
 |
|
| Ares12 |  |
 |
 |
 |
 |
 |
 |
 |
 |
 |
|
| SD-2x1Wire |  |
 |
 |
 |
 |
 |
 |
 |
 |
 |
|
| HWg-PWRxx |  |
 |
 |
 |
 |
 |
 |
 |
 |
 |
|
| SD-2xIn |  |
 |
 |
 |
 |
 |
 |
 |
 |
 |
|
| SD-WLD |  |
 |
 |
 |
 |
 |
 |
 |
 |
 |
|
| HWg-STE Plus |  |
 |
 |
 |
 |
 |
 |
 |
 |
 |
|
| STE2 |  |
 |
 |
 |
 |
 |
 |
 |
 |
 |
|
| HWg-WLD |  |
 |
 |
 |
 |
 |
 |
 |
 |
 |
|
| WLD2 |  |
 |
 |
 |
 |
 |
 |
 |
 |
 |
|
| IP WatchDog Lite |  |
 |
 |
 |
 |
 |
 |
 |
 |
 |
|
| IP WatchDog Industrial |  |
 |
 |
 |
 |
 |
 |
 |
 |
 |
|
Values.xml – Export of measured values and connecting to third-party software
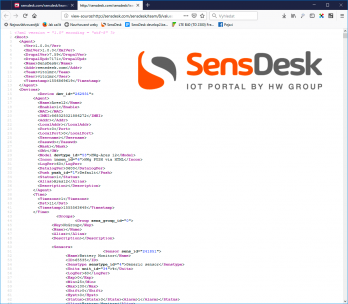 Different HW group devices may generate different XML data formats. When using SensDesk, the output XML for a master system looks like a single device with many sensors.
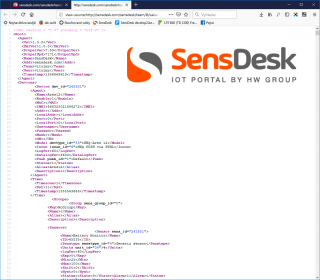
Many companies now use a monitoring or information system, such as Nagios or another NMS in the IT sector, or PRTG in facility management. Integration of new devices into existing systems is expensive, and system managers are often reluctant to implement more than one device or protocol. However, different devices cannot have the same communication protocol due to the different nature of the measured quantities, or simply due to technical evolution. SensDesk allows to integrate all HW group devices into a single system with a unified XML format; for a master system, Sensdesk behaves as a single device with many sensors. For the user, there are values.XML files available for the whole Team (containing the current readings from all sensors and detectors) as well as for individual dashboards. The XML files can be accessed with http username/password authentication or with a URL containing an authentication key. For more details about the XML format, see the protocol description.
Other interesting SensDesk features
Dashboard
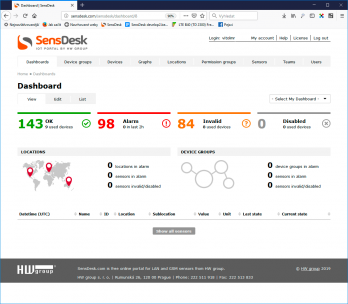 The Dashboard is a signpost and control center. It allows to get quick overview about how many sensors are OK and how many are in alarm, not reporting or turned off.
A single click leads to the list of such sensors. A significant advantage is the ability to create custom Dashboards, for instance displaying only devices that relate to a particular process or technology area (e.g. only refrigerators, only freezers, or only electricity consumption). With a custom Dashboard, users do not have to waste time figuring out whether a sensor in alarm belongs to their area of responsibility, and instead concentrate on their work.
Groups and Locations
Groups and Locations can be used to logically structure the network according to users’ needs.
When a user has more than just a couple of devices in SensDesk, it is usually a good idea to group related devices together. For this purpose, SensDesk uses Groups and Locations. Both of these features allow to group related devices together; however, the usage is different. Locations relate to physical locations of devices (Prague, New York, 1st floor etc.), while Groups relate to logical groupings (servers, engineering, etc.). This is reflected in different behavior. Only an entire device can be assigned to a Group. At the same time, one device can belong to several Groups. On the other hand, one device can belong to only one Location. However, Locations can be broken down to Sublocations, where individual sensors can be assigned.
Graphs
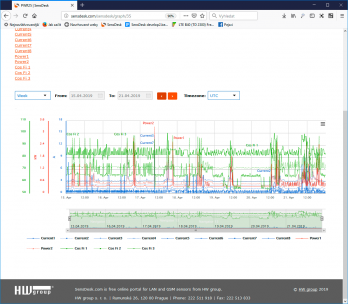 SensDesk allows you to create graphs that combine sensors and measured values in order to display critical process values simultaneously.
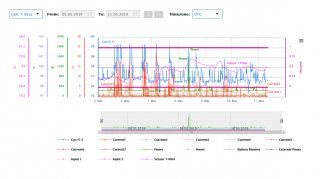
Any portal solution includes graphing features. SensDesk can generate graphs for individual sensors or detectors as well as a quick device-level overview. There, the graphs are separated according to the unit of measurement so that the rendering of different quantities is not mixed up in a single graph. However, the added value of SensDesk is the ability to create graphs with multiple sensors regardless of the unit of measurement. This allows to easily visualize and monitor interdependencies of quantities and values. For example, it can be found out that a temperature drop in a room was caused by an open door or a rise in humidity. Rising costs of laundry drying may be caused by high external temperature. And so on. These and many other pieces of information can be very useful to save operational costs or as an early warning about possible malfunctions.
What is Teams and User Management
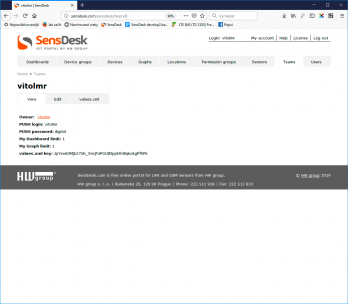 Devices and device groups can be displayed to selected users, and data tracking, control and device administration functions can be separated.
In order to efficiently and securely share data among several users, these users need to be grouped under a Team. Usually, a Team would be a company; it can also be an interest group or just a company department. A Team has an owner that can add users and set their roles. A Team is also subject to all limits and restrictions applied at the portal level. Push parameters, including PUSH login and PUSH password, also apply to a Team as a whole. Therefore, the devices do not belong to an individual user anymore; they belong to the Team. This greatly simplifies the situation when responsible people change in the company. A serialized output of all values in a XML file is also available for every Team.
Types of user roles
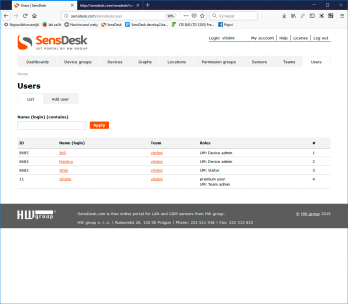 UM: Team admin – Has all the privileges to work with the Team. The admin can add users, add devices, set alarms or add dashboards and graphs.
- UM: Device admin – May add and configure individual devices and sensors, and obviously view the measured values. In combination with the Permission groups function, these users may be restricted to working with selected devices only, in order to increase system security as well as simplify the work of individual users.
- UM: Report admin – Reserved for future use. The Report admin will be able to configure and edit reports, such as overviews of the measured values, displayed data and so on.
- UM: Visitor – Can only view data.
My Graph function in the SensDesk portal – Compare your readings
The SensDesk Technology portal allows users to compare values from different sensors, even if different quantities and scales are involved. This function is called My Graph and it is also available in SensDesk.com.
Horizontal menu
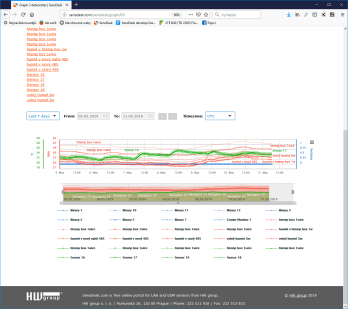 Plotting the values of one quantity in a simple graph is a standard feature of any monitoring software, including PDMS, Nagios, PRTG or SensDesk. It is even included in some devices, such as HWg-PWR (although it tends to be limited in such cases). Graphs provide a quick overview and analysis of the measured data. They make it easy to spot rising or falling trends or periodic events. Some software systems can plot the readings from several sensors in one graph, as long as the measured physical quantity is the same. However, few applications can plot different quantities with different scales in a single graph because such an ability is computationally and graphically demanding.
Typical applications of My Graph
The My Graph function is used to compare multiple measured values in order to spot any dependencies. This is useful for analyzing the causes of alarm situations as well as for optimizing the operation of equipment such as HVAC.
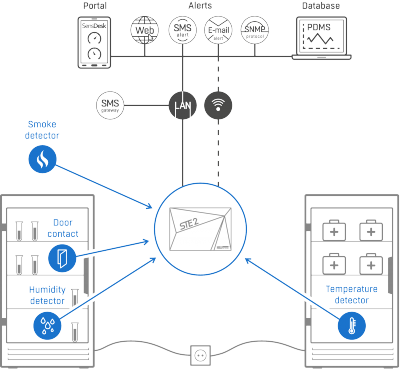 Checking the temperature in refrigerators, freezers and cooling boxes
It is important to monitor temperatures in refrigerated areas where doors are frequently open or closed. By looking at temperatures and other sensors in time, it is possible to detect faulty refrigeration equipment; for example, causes of rising temperature can be identified by correlating temperatures with door contacts. If the temperature only rises when someone enters the cooler, there is no reason for concern. The graphs can be also used to generate reports with temperature values plotted in time in order to demonstrate compliance with storage requirements, e.g. for food, pharmaceuticals or other critical substances. For monitoring temperature and humidity, devices such as STE2 or Poseidon2 3266 can be used.
With a HWg-PWR25 device, energy consumption metering can be added to the system. By comparing the temperature in the refrigerated area with the energy consumption, it is possible to detect frost buildup or coolant leaks (rising electricity consumption without a change in temperature is an indication of an imbalance in the system and rising costs).
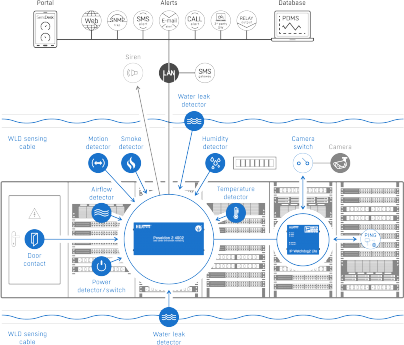 Monitoring the environment and hot and cold aisles in server rooms
Environment monitoring frequently involves checking the temperature in racks or data centers. For administrators, this information is absolutely essential, even though they may hesitate to store this data in a third-party portal. This information allows to correlate temperatures in a rack with doors being opened and closed, or to compare temperature trends in a cold aisle in a data center with door contacts, air flow and humidity; this can help identify problems with air circulation, such as mechanical obstructions caused by users or A/C technical problems. As a result, it is possible to reduce datacenter operating costs and increase reliability for customers. In datacenters, frequently used devices include Poseidon2 4002 and Poseidon2 3268.
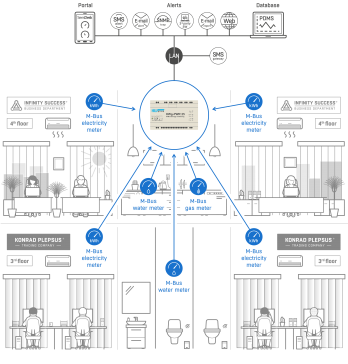 Energy consumption monitoring in office spaces
In office spaces, environment monitoring is usually a complete solution that, in addition to electricity consumption and temperature, also monitors parameters such as lighting intensity and air quality. Even though these parameters may fall into the Measurement & Control domain, independent monitoring has its place in energy management and in ensuring correct function in order to maintain productivity and efficiency. When blinds in a building are raised on a hot sunny day, A/C operation may become very expensive. Vice versa, when blinds are shut outside of the heat peaks, artificial lighting is used unnecessarily and, if coupled with lower air quality, reduces staff productivity. For these applications, Poseidon2 3468 and HWg-PWR12 are frequently used. These devices can be installed on DIN rails in electrical cabinets.
Temperature and humidity monitoring in greenhouses
When growing plants in closed greenhouses, air circulation needs to be ensured in order to maintain a homogeneous environment. By monitoring temperature and humidity at several places at the same time, crop yield and quality can be improved. Suitable devices include Poseidon2 4002 or Ares 12 that can, for instance, control multi-point air circulation together with automated watering.
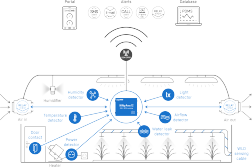
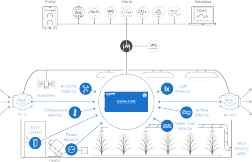
Monitoring environment stability and producing heatmaps in warehouses
In many cases, it is necessary to monitor whether the environment in the given premises is stable, i.e. without significant fluctuations. This monitoring may be important to preserve the stored goods (food, flowers etc.), as well as for diagnostic purposes. Temperature or humidity sensors must be placed at the important locations, but also away from sources of false alarms, such as due to draught. With the My Graph function, it is easy to show the differences of the respective values and to list details.
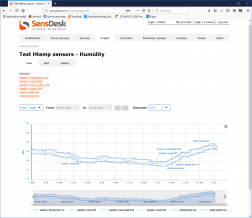
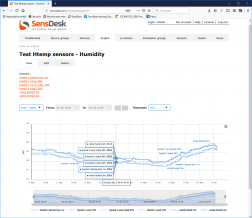
For more information about the graph functions and their use, see a separate Application note or the video below.
Download
Controlling the outputs of Poseidon2, Damocles2, Ares12 and SD-2xOut
All Damocles2 devices, selected Poseidon2 devices, as well as Ares12 devices with the optional 1-Wire Output module offer outputs that can be used for manual or automated control of appliances and custom equipment.
Horizontal menu
The following table shows selected devices with outputs that can be used for manual or automated control of appliances and custom equipment:
| Product | Outputs | Output type | Load |
| Poseidon2 3268 | 2 | Relay | 24VDC (60VAC) / 1A |
| Poseidon2 4002 | 4 | Relay | 24VDC (60VAC) / 1A |
| Poseidon2 3468 | 2 | Relay | 230VAC / 10A |
| Damocles2 MINI | 2 | Relay | 24VDC (60VAC) / 1A |
| Damocles2 1208 | 8 | Open Collector | 50V / 0.5A |
| Damocles2 2404 | 4 | Relay | 24VDC (60VAC) / 1A |
| Ares10/Ares12 (LTE) | 4 | Relay (external)* | 24VDC (60VAC) / 1A |
| SD-2xOUT | 2 | Relay | 50V / 0.5A |
* With the optional Relay Output 1W-UNI external module
Control methods
The outputs can be controlled either manually, or using a condition (local or remote). However, the choice between local or remote control must be made in advance. These two methods cannot be combined; such a combination could lead to issues, such as when the user would manually turn off a system activated with a local condition or vice versa. Reliable industrial devices must not be prone to such mishaps.
On/off actions are used to turn on back-up systems, to give a visual or acoustic warning signal or to activate other types of emergency systems such as additional cooling, a water pump, and so on.
Pulse output is typically used to reset communication equipment, restore the operation of a control unit, or to raise alarm.
Outputs can be controlled by simply switching the output on or off, as well as by creating a pulse of a defined duration. In all cases, the pulse output is activated by specifying the “Pulse Timer” parameter in the Outputs section of the given device.
Uses
- Manual control over WWW (on/off or pulse)
- Manual control from the AresConf application (on/off or pulse)
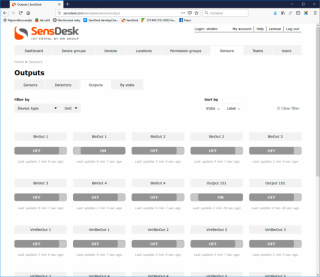
- Manual control from the SensDesk portal (on/off)
- Activating an output using a local condition (on/off or pulse)
- Remote control using the WWW interface of another device (on/off or pulse)
- Activating an output using a condition from another device (on/off or pulse)
- Activating an output using a condition in the SensDesk portal (on/off)
Manual control over WWW
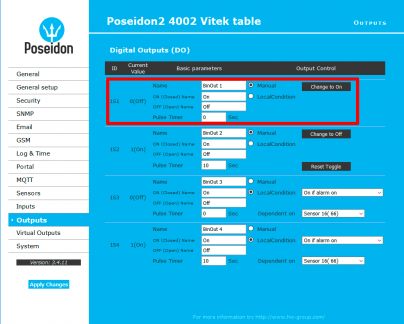
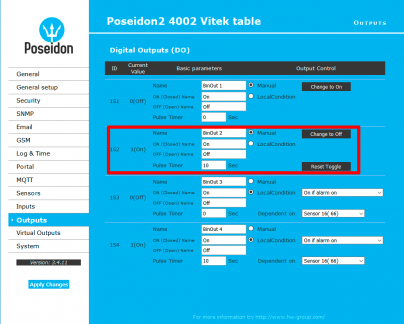
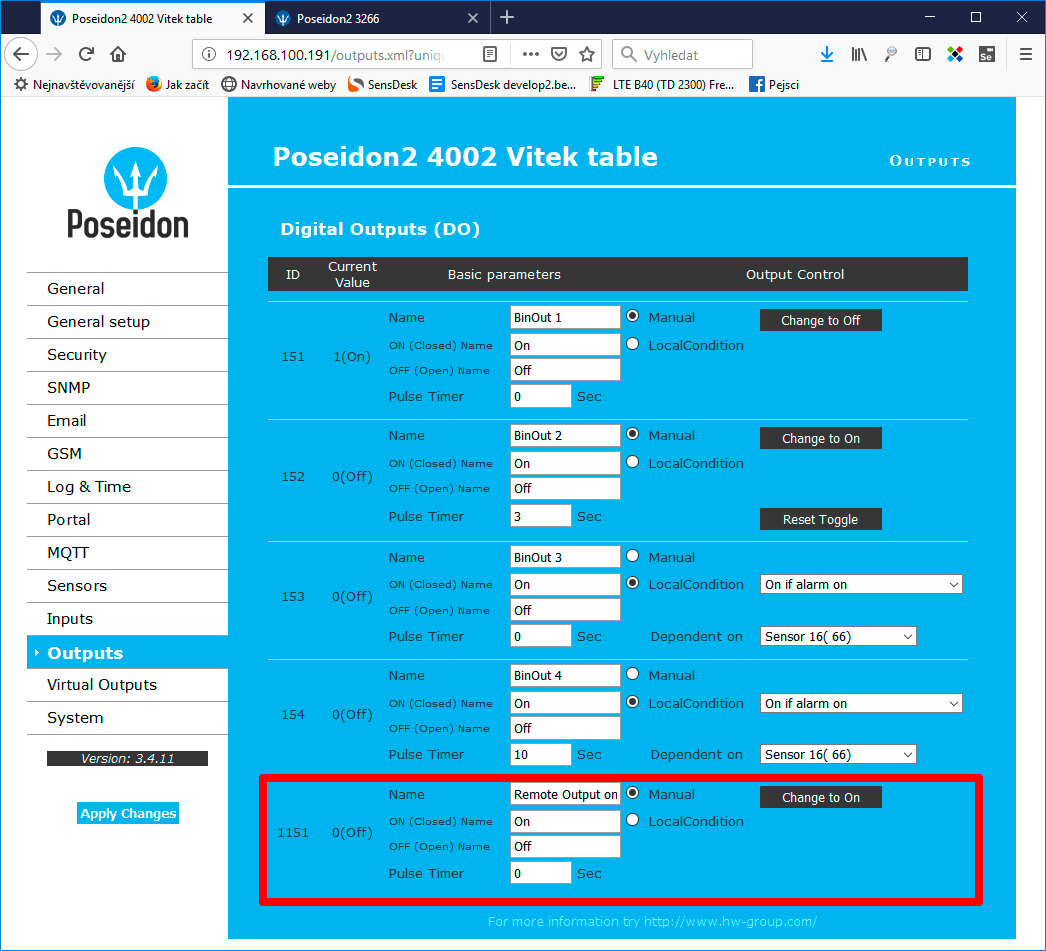
Manual control is effected by pressing a button in the Outputs tab in the WWW interface of a Poseidon2 or a Damocles2 device. It is only possible if the output is in the Manual mode. If the output is in the LocalCondition mode, it cannot be controlled manually. The output is controlled by pressing the Change to On or Change to Off button respectively, depending on the current state of the output.
To be able to switch the output on/off for a short time only (power cycle), simply fill out the Pulse Timer parameter. When the Reset Toggle button is pressed, the output state is changed only for the defined time. Although it is possible to the Change to On and Reset Toggle buttons in combination, we strongly discourage it if you cannot directly observe the results. The reason is that the Change to On button inverts the function of the Reset Toggle button.
Manual control of outputs from the AresConf application
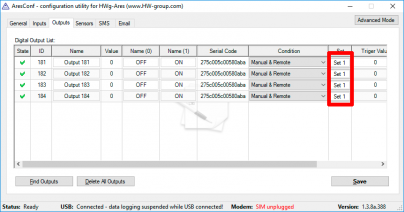
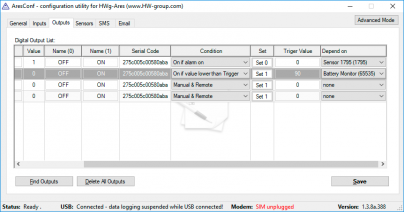
Hwg-Ares12, HWg-Ares14 and Ares12LTE units can be connected to an external Relay output 1W-UNI module using the 1-Wire bus. This allows extending the functionality of the Ares unit with remote relay control as well as local conditions. Manual control is effected by pressing the Set1 (close) or Set0 (open) button at the Outputs tab of the AresConf application. It is only possible if the output is in the Manual & Remote mode. If the output is in the LocalCondition mode, it cannot be controlled manually.
Activating an Ares output using a local condition (on/off)
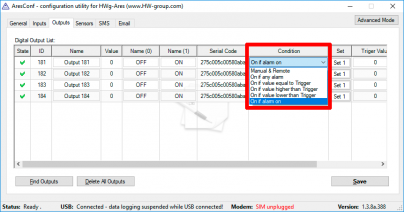
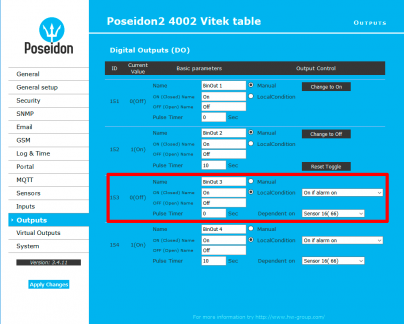
The LocalCondition mode allows switching an output in reaction to a state or value change at a sensor or input connected to the device. This is sometimes called the “thermostat” function, referring to the typical application in heating control. In a similar way, water can be pumped into a tank if the level drops, or simply a warning light or a horn can be turned on.
The local condition mode is again set at the Output tab.
The following options are available:
- On if any alarm – the output is activated if at least one input or sensor is in alarm. The reaction of the output depends on the Alarm state (Hysteresis and Delay functions are taken into account).
- On if value equal to Trigger – the output is activated whenever the sensor value is equal to the “Trigger value” (Saferange, Hysteresis and Delay functions are disregarded – oscillations may appear if the value fluctuates around the “Trigger value”).
- On if value higher than Trigger – the output is activated whenever the sensor value is higher than the “Trigger value” (Saferange, Hysteresis and Delay functions are disregarded – oscillations may appear if the value fluctuates around the “Trigger value”).
- On if value lower than Trigger – the output is activated whenever the sensor value is lower than the “Trigger value” (Saferange, Hysteresis and Delay functions are disregarded – oscillations may appear if the value fluctuates around the “Trigger value”).
- On if alarm on – the output is activated if the selected sensor or input is in the alarm state (Hysteresis and Delay functions are taken into account).
Manual control from the SensDesk portal (on/off)
Manual control of outputs from the SensDesk portal is detailed in the Application note - Controlling outputs from SensDesk, available at https://www.hw-group.com/support/controlling-outputs-from-sensdesk.
Again, only outputs in the Manual mode can be controlled. However, unlike the control via the WWW interface, SensDesk only provides “on/off” control, without the pulse output option.
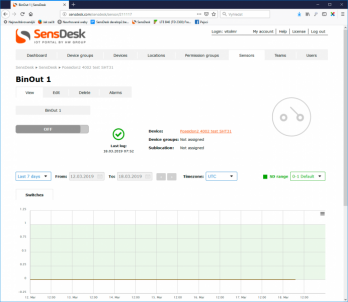
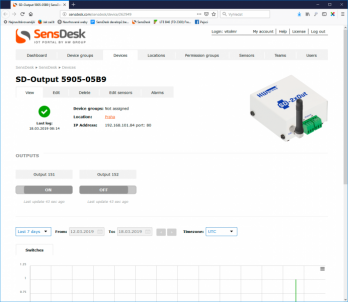
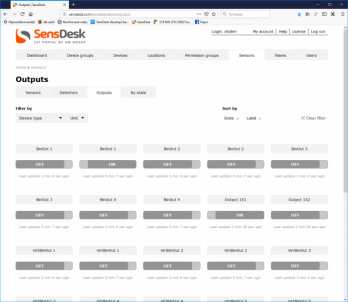
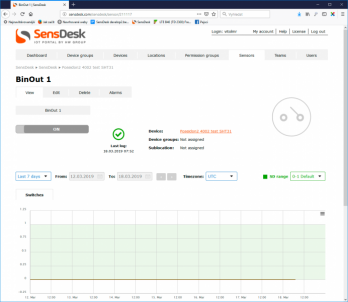
An output can be controlled from the output overview page, the respective device page or the specific output page by clicking the corresponding gadget. The default state is neutral:
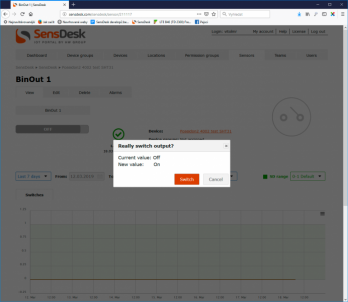
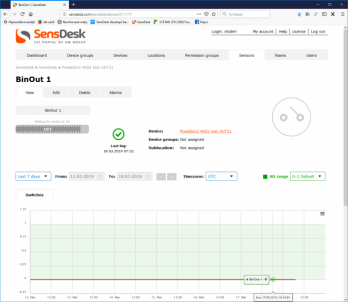
If the switch is moved to one side or the other, SensDesk instructs the output to be set accordingly:
Depending on the device settings, this instruction is executed within the standard Push period (15 minutes) or in the shortened period (60 s). Before the instruction is executed, the output state can be changed again, or the change cancelled. The device page does not refresh automatically; it must be refreshed manually.
Activating an output using a local condition (on/off or pulse)
The LocalCondition mode allows switching an output in reaction to a state or value change at a sensor or input connected to the device. This is sometimes called the “thermostat” function, referring to the typical application in heating control. In a similar way, water can be pumped into a tank if the level drops, or simply a warning light or a horn can be turned on.
The local condition mode is again set at the Output tab.
The following options are available:
- On if any alarm – the output is activated if at least one input or sensor is in alarm. The reaction of the output depends on the Alarm state (Hysteresis and Delay functions are taken into account).
- On if value equal to Trigger – the output is activated whenever the sensor value is equal to the “Target value” (Saferange, Hysteresis and Delay functions are disregarded – oscillations may appear if the value fluctuates around the “Target value”).
- On if value higher than Trigger – the output is activated whenever the sensor value is higher than the “Target value” (Saferange, Hysteresis and Delay functions are disregarded – oscillations may appear if the value fluctuates around the “Target value”).
- On if value lower than Trigger – the output is activated whenever the sensor value is lower than the “Target value” (Saferange, Hysteresis and Delay functions are disregarded – oscillations may appear if the value fluctuates around the “Target value”).
- On if alarm on – the output is activated if the selected sensor or input is in the alarm state (Hysteresis and Delay functions are taken into account).
To be able to switch the output on/off for a short time only (power cycle), simply fill out the Pulse Timer parameter. Then, the output state is changed in response to the condition only for the defined time.
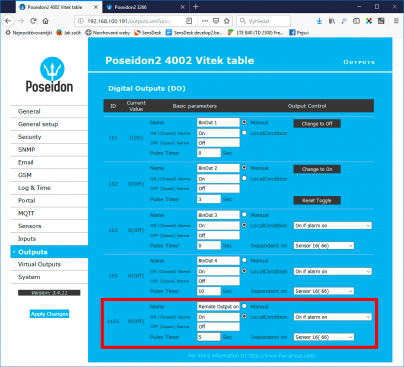
Local conditions can be used not only for local physical outputs but also for remote outputs. With Poseidon2 and Damocles2 devices, communication and cooperation among two or more such devices is possible (M2M mode). This is achieved with the Virtual outputs function – for details, see Activating an output using a condition on another device. This is useful, for example, when one device senses the level of a liquid in a tank and another device controls the corresponding pump, or when one device monitors the temperature and humidity in an environment and another device controls the air-conditioning unit.
Remote control using the WWW interface of another device (on/off or pulse)
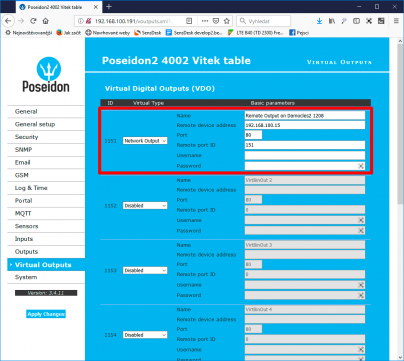
Thanks to the Virtual Outputs function in Poseidon2 and Damocles2 units, it is possible to control outputs remotely from the WWW interface of another device. This function allows connecting remote outputs of Poseidon2 and Damocles2 units to the WWW interface of another unit. It is configured at the Virtual Outputs tab.
Support of Virtual outputs in HW group devices
| Local Condition | Controlled | Poseidon2 3268 | Poseidon2 4002 | Poseidon2 3468 | Damocles2 MINI | Damocles2 1208 | Damocles2 2404 | Ares12 | SD-2xOUT | IP WatchDog2 Lite | IP WatchDog2 Industrial |
|---|---|---|---|---|---|---|---|---|---|---|---|
| Controlling | |||||||||||
| Poseidon2 3266 |  |
 |
 |
 |
 |
 |
 |
 |
 |
 |
|
| Poseidon2 3268 |  |
 |
 |
 |
 |
 |
 |
 |
 |
 |
|
| Poseidon2 4002 |  |
 |
 |
 |
 |
 |
 |
 |
 |
 |
|
| Poseidon2 3468 |  |
 |
 |
 |
 |
 |
 |
 |
 |
 |
|
| Damocles2 MINI |  |
 |
 |
 |
 |
 |
 |
 |
 |
 |
|
| Damocles2 1208 |  |
 |
 |
 |
 |
 |
 |
 |
 |
 |
|
| Damocles2 2404 |  |
 |
 |
 |
 |
 |
 |
 |
 |
 |
|
| Ares12 (LTE) |  |
 |
 |
 |
 |
 |
 |
 |
 |
 |
|
| HWg-PWRxx |  |
 |
 |
 |
 |
 |
 |
 |
 |
 |
|
| SD-2x1Wire |  |
 |
 |
 |
 |
 |
 |
 |
 |
 |
|
| SD-2xIn |  |
 |
 |
 |
 |
 |
 |
 |
 |
 |
|
| SD-WLD |  |
 |
 |
 |
 |
 |
 |
 |
 |
 |
|
| HWg-STE Plus |  |
 |
 |
 |
 |
 |
 |
 |
 |
 |
|
| STE2 |  |
 |
 |
 |
 |
 |
 |
 |
 |
 |
|
| HWg-WLD |  |
 |
 |
 |
 |
 |
 |
 |
 |
 |
|
| WLD2 |  |
 |
 |
 |
 |
 |
 |
 |
 |
 |
|
| IP WatchDog Lite |  |
 |
 |
 |
 |
 |
 |
 |
 |
 |
|
| IP WatchDog Industrial |  |
 |
 |
 |
 |
 |
 |
 |
 |
 |
|
Up to 8 remote outputs can be connected to a Poseidon2 or a Damocles2 and then controlled just as if they were local outputs. Before using remote outputs, it is necessary to configure IP parameters; therefore, unconfigured outputs are Disabled by default. Virtual outputs cannot be connected to devices without local outputs.
After enabling, it is possible to configure the output name, IP address of the remote device, ID of the remote output (can be found at the Outputs tab), and also a username and a password if the remote device requires authentication (“Read only + Outputs” or “Read + Write” access level).
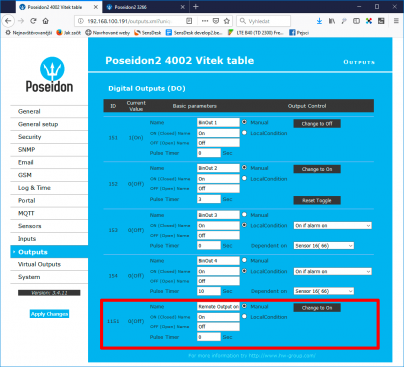
The virtual output then appears as another output at the Outputs tab, where it can be controlled just as if it was a local output. This makes it possible to control outputs at multiple devices through a single WWW interface and with a single authentication username and password.
The main advantage is that the remote output is set to the proper state periodically; if there is a power outage at the remote device’s site, the output will be again set to the correct state when the power is restored.
To be able to switch the output on/off for a short time only (power cycle), simply fill out the Pulse Timer parameter. Then, the output state is changed in response to the condition only for the defined time.
For more information about the Virtual outputs function, see the Virtual outputs in Poseidon2/Damocles2 application note at: https://www.hw-group.com/support/virtual-outputs-in-poseidon2damocles2
Activating an output using a condition from another device (on/off or pulse)
The option to control outputs using conditions from another device extends the ways in which multiple Poseidon2 and Damocles2 units can communicate. It uses the Virtual Outputs function in Poseidon2 and Damocles2 units. This function allows connecting remote outputs of Poseidon2 and Damocles2 units to the WWW interface of another unit. It is configured at the Virtual Outputs tab.
Support of Virtual outputs in HW group devices
| Local Condition | Controlled | Poseidon2 3268 | Poseidon2 4002 | Poseidon2 3468 | Damocles2 MINI | Damocles2 1208 | Damocles2 2404 | Ares12 | SD-2xOUT | IP WatchDog2 Lite | IP WatchDog2 Industrial |
|---|---|---|---|---|---|---|---|---|---|---|---|
| Controlling | |||||||||||
| Poseidon2 3266 |  |
 |
 |
 |
 |
 |
 |
 |
 |
 |
|
| Poseidon2 3268 |  |
 |
 |
 |
 |
 |
 |
 |
 |
 |
|
| Poseidon2 4002 |  |
 |
 |
 |
 |
 |
 |
 |
 |
 |
|
| Poseidon2 3468 |  |
 |
 |
 |
 |
 |
 |
 |
 |
 |
|
| Damocles2 MINI |  |
 |
 |
 |
 |
 |
 |
 |
 |
 |
|
| Damocles2 1208 |  |
 |
 |
 |
 |
 |
 |
 |
 |
 |
|
| Damocles2 2404 |  |
 |
 |
 |
 |
 |
 |
 |
 |
 |
|
| Ares12 (LTE) |  |
 |
 |
 |
 |
 |
 |
 |
 |
 |
|
| HWg-PWRxx |  |
 |
 |
 |
 |
 |
 |
 |
 |
 |
|
| SD-2x1Wire |  |
 |
 |
 |
 |
 |
 |
 |
 |
 |
|
| SD-2xIn |  |
 |
 |
 |
 |
 |
 |
 |
 |
 |
|
| SD-WLD |  |
 |
 |
 |
 |
 |
 |
 |
 |
 |
|
| HWg-STE Plus |  |
 |
 |
 |
 |
 |
 |
 |
 |
 |
|
| STE2 |  |
 |
 |
 |
 |
 |
 |
 |
 |
 |
|
| HWg-WLD |  |
 |
 |
 |
 |
 |
 |
 |
 |
 |
|
| WLD2 |  |
 |
 |
 |
 |
 |
 |
 |
 |
 |
|
| IP WatchDog Lite |  |
 |
 |
 |
 |
 |
 |
 |
 |
 |
|
| IP WatchDog Industrial |  |
 |
 |
 |
 |
 |
 |
 |
 |
 |
|
Up to 8 remote outputs can be connected to a Poseidon2 or a Damocles2 and then controlled just as if they were local outputs. Before using remote outputs, it is necessary to configure IP parameters; therefore, unconfigured outputs are Disabled by default. Virtual outputs cannot be connected to devices without local outputs.
After enabling, it is possible to configure the output name, IP address of the remote device, ID of the remote output (can be found at the Outputs tab), and also a username and a password if the remote device requires authentication (“Read only + Outputs” or “Read + Write” access level). The virtual output then appears as another output at the Outputs tab, where it can be controlled just as if it was a local output.
The main advantage is that the remote output is set to the proper state periodically; if there is a power outage at the remote device’s site, the output will be again set to the correct state when the power is restored.
To be able to switch the output on/off for a short time only (power cycle), simply fill out the Pulse Timer parameter. Then, the output state is changed in response to the condition only for the defined time.
For more information about the Virtual outputs function, see the Virtual outputs in Poseidon2/Damocles2 application note at: https://www.hw-group.com/support/virtual-outputs-in-poseidon2damocles2
Activating an output using a condition in the SensDesk portal (on/off)
Activating an output of a remote unit using a SensDesk condition is one of the highest feats in terms of cooperation and communication among multiple devices (M2M mode). It requires cooperation not just among devices of the same family, but also among different devices that do not share a common communication protocol other than HWg-PUSH to communicate with the SensDesk portal.
Support for controlling outputs using SensDesk conditions
| Push protocol | Controlled | Poseidon2 3268 | Poseidon2 4002 | Poseidon2 3468 | Damocles2 MINI | Damocles2 1208 | Damocles2 2404 | Ares12 | SD-2xOUT | IP WatchDog2 Lite | IP WatchDog2 Industrial |
|---|---|---|---|---|---|---|---|---|---|---|---|
| Controlling | |||||||||||
| Poseidon2 3266 |  |
 |
 |
 |
 |
 |
 |
 |
 |
 |
|
| Poseidon2 3268 |  |
 |
 |
 |
 |
 |
 |
 |
 |
 |
|
| Poseidon2 4002 |  |
 |
 |
 |
 |
 |
 |
 |
 |
 |
|
| Poseidon2 3468 |  |
 |
 |
 |
 |
 |
 |
 |
 |
 |
|
| Damocles2 MINI |  |
 |
 |
 |
 |
 |
 |
 |
 |
 |
|
| Damocles2 1208 |  |
 |
 |
 |
 |
 |
 |
 |
 |
 |
|
| Damocles2 2404 |  |
 |
 |
 |
 |
 |
 |
 |
 |
 |
|
| Ares12 |  |
 |
 |
 |
 |
 |
 |
 |
 |
 |
|
| SD-2x1Wire |  |
 |
 |
 |
 |
 |
 |
 |
 |
 |
|
| HWg-PWRxx |  |
 |
 |
 |
 |
 |
 |
 |
 |
 |
|
| SD-2xIn |  |
 |
 |
 |
 |
 |
 |
 |
 |
 |
|
| SD-WLD |  |
 |
 |
 |
 |
 |
 |
 |
 |
 |
|
| HWg-STE Plus |  |
 |
 |
 |
 |
 |
 |
 |
 |
 |
|
| STE2 |  |
 |
 |
 |
 |
 |
 |
 |
 |
 |
|
| HWg-WLD |  |
 |
 |
 |
 |
 |
 |
 |
 |
 |
|
| WLD2 |  |
 |
 |
 |
 |
 |
 |
 |
 |
 |
|
| IP WatchDog Lite |  |
 |
 |
 |
 |
 |
 |
 |
 |
 |
|
| IP WatchDog Industrial |  |
 |
 |
 |
 |
 |
 |
 |
 |
 |
|
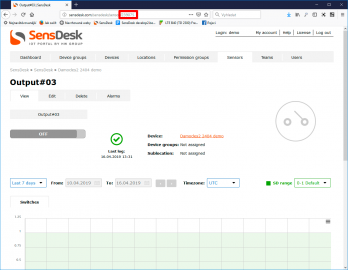
At this time, the functionality for output control conditions in SensDesk is still being developed. For this reason, it is not very comfortable yet because the user needs to know the SensDesk ID of the controlled output. The easiest way to find it is to look at the URL of the output:
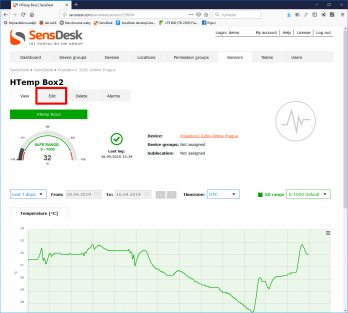
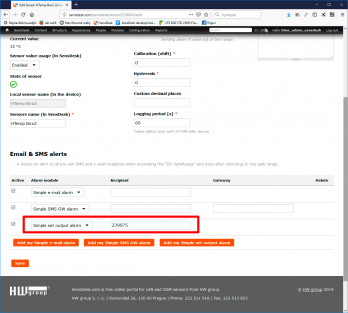
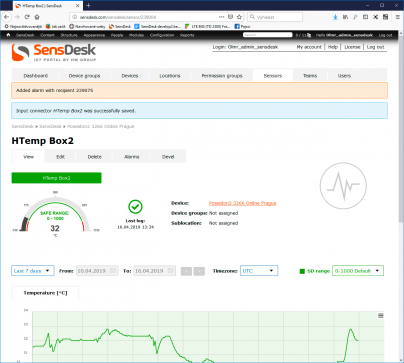
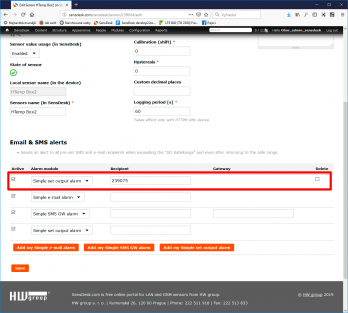
The condition is then created by editing the sensor on which the output should depend. First open the details of the sensor, switch to editing mode, and under Email & SMS alerts find the Simple set output alarm item. There, enter the ID of the output to control in the Recipient field.
The condition becomes active as soon as it is saved by clicking Save:
From this moment on, whenever the sensor goes into the Alarm state, the remote contact is closed. Likewise, when the sensor returns to the Normal state, the remote contact opens. Loss of communication with the sensor is treated as an Alarm and the remote output is closed.
To delete the condition, go again to the Edit Sensor page and check the Delete box next to the rule to delete. Confirm by clicking Save.
For more detail about the control using conditions, see the separate Activating a remote output using a SensDesk condition application note at: https://www.hw-group.com/support/activating-a-remote-output-using-a-sensdesk-condition

